
Our first geographic boards were designed to show rain data, but it became clear that our customers wanted to display more than just rain, so we developed a new generation of ‘map trackrs’, which can show more than rain.
These new map trackrs have the advantage of individually dimmable LEDs (64 brightness levels per LED, rather than just on/off) which lets us display much more detailed information.
The geographic maps lend themselves to environmental/weather data, so we’ve added wind and cloud cover in addition to the original rain layer.
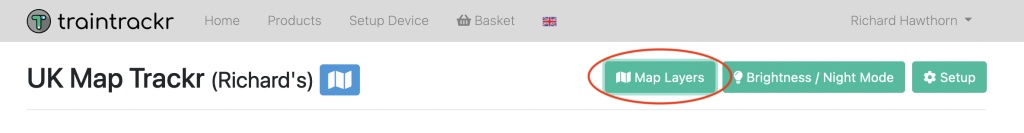
To change the layer your board displays, login to your dashboard, click your device, and then click ‘Map Layers’
This will then show you a modal with the avalibale layers for your map type.
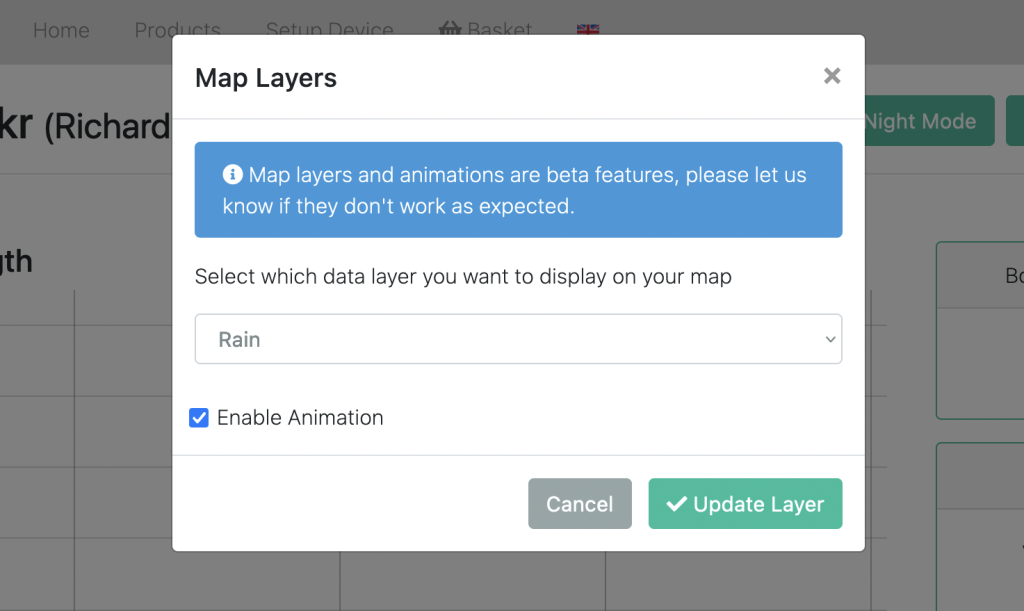
In addition to the new layers, we also added the ability to animate the data. This cycles through the most recent 6 frames of data, ending on the most recent frame.
We update rain data every 15 minutes, so the rain animation shows 75 minutes of data.
We update wind and cloud data every 3 hours, so this animation shows 15 hours of data.
We’ll be adding more data layers in the future, what else do you want to see on your trackrs?